A blue color ramp is used to represent the risk category for each hexagon. The more saturated the color, the greater opportunity and need for impact work (improved monitoring, conservation projects, forest management implementation, etc.).
Many interacting factors contribute to sustainability criteria outcomes at a landscape scale (e.g. climate change, land-use changes, pollution, etc.). Accordingly, low, medium or high risk (e.g. risk of forest carbon loss or presence of imperiled species) designations cannot logically or reputably be attributed to any one cause or land-use type.
Timberland Ownership by Type
Aggregated by county within selected regions of sourcing
Total Certified Timberland Acres
Aggregated by state(s) where selected mills are located
OWNERSHIP & CERTIFICATION
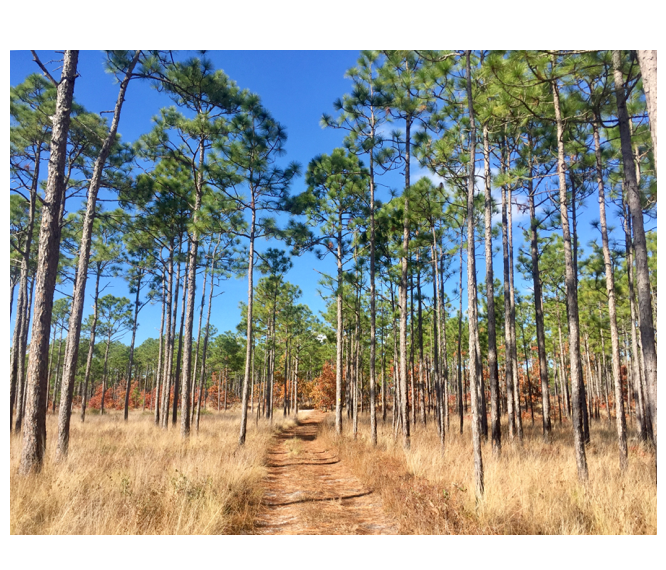
The criterion was designed to provide insights into timberland being utilized by the forest product supply chain, while also illuminating the use of certification, particularly on family-owned forest lands. Timberland is forest land that is at least one acre, not legally withdrawn from timber production, and that is capable of producing more than 20 cubic feet per acre per year of [industrial] wood. Specific to your geography of interest, Forests in Focus displays information on:
- Acres: Timberland acres (within each of the selected state(s) and in counties within the selected region(s) of sourcing)
- Ownership: Timberland owned by private, family forest owners* (in acres and as a percentage)
- Certified Timberland:
- Total acres of ATFS, FSC, SFI and Dual FSC/SFI (within each of the selected state(s))
- Percent of family forest owned timberland certified to ATFS (in counties within the region(s) of sourcing)
The Ownership & Certification criterion allows users to visualize the extent of certification adoption within the geography of interest. It complements certification by identifying possible correlations between sustainability performance and certification, while also indicating key areas for certification expansion. Whereas forest certification verifies the use of specific practices on individual parcels of forests, the Ownership and Certification criterion assesses how management on both certified and uncertified lands MAY influence sustainability at scale. This approach is more commensurate with the scale of sourcing for brands, forest product companies and others.
* The term ’family forest ownership’ is synonymous with the US Forest Service FIA ‘family and individual ownership’ category.
For additional information, please visit the Ownership & Certification page.
LAND USE CHANGE
This criterion estimates the percent net change of [land classified as] timberlands within the geography of interest, over a five-year period. Where timberland change (loss or gain) occurs, we indicate which land-use types this change can most likely be attributed to:
- Agriculture: row crops, such as soy, cotton, etc.
- Development: housing or commercial development, etc.
- Other: transitions to lower density forests (which are unlikely to be supply mills), water encroachment, and conversion to rangeland.
**As a result of differences in the methodology used to scale data (from plot to Hexagon or from plots to Assessment Area), percent and net change results may differ slightly between the Assessment Area Dashboard and Summary Dashboard.
RISK THRESHOLDS
| LOWER RISK | MEDIUM RISK | HIGHER RISK | |
| Land Use Change | Less than or equal to 1% net loss of timberland annually, or a 5% net loss over a five-year period. | Between 1% to 2% net loss of timberland annually, or a 5% to 10% net loss over a five-year period. | More than 2% net loss of timberland annually, or a 10% net loss over a five-year period. |
For additional information, please visit the Land Use Change page.
FOREST CARBON
SUMMARY
This criterion estimates the net change of [above ground] carbon stored in the geography of interest, over a five-year period. Forests in Focus uses FIA wood volume data to provide estimates of carbon stored in above-ground woody biomass, such as tree stems, bark, and branches (i.e. not soil). Since forests are significant sinks for atmospheric carbon dioxide, scientists and sustainability professionals are interested in understanding how much and for how long carbon stays within that forest [carbon pool]. Because of the close relationship of forest carbon and biomass, growth and drain ratios do ‘double duty’, providing an estimate of the net change of forest carbon volume while also indicating if the amount of biomass (trees) removed from forests is being regrown.
The following equation may be helpful in visualizing this concept:

**As a result of differences in the methodology used to scale data (from plot to Hexagon or from plots to Assessment Area), percent and net change results may differ slightly between the Assessment Area Dashboard and Summary Dashboard.
RISK THRESHOLDS
| LOWER RISK | MEDIUM RISK | HIGHER RISK | |
| Forest Carbon | Less than or equal to 1% net loss of above-ground wood volume annually, or a 5% net loss over a five-year period. | Between 1% to 2% net loss of above-ground wood volume annually, or a 5% to 10% net loss over a five-year period. | More than 2% net loss of above-ground wood volume annually, or a 10% net loss over a five-year period. |
For additional information, please visit the Forest Carbon page.
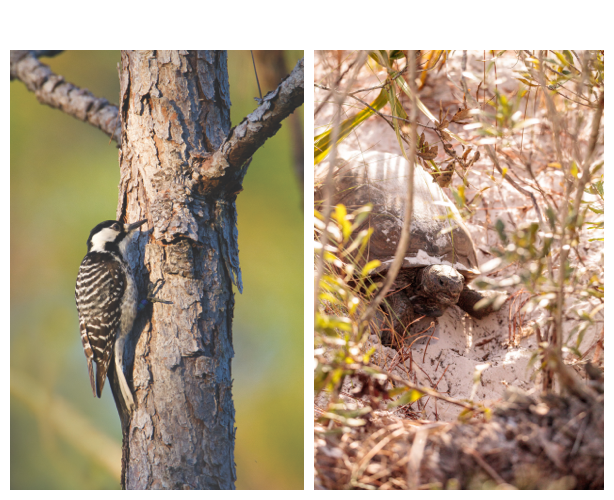
IMPERILED SPECIES
This criterion estimates the number of critically imperiled or imperiled species present in the geography of interest. In the Assessment Area Dashboard we use NatureServe data to report the following information at a Hex and Assessment Area level:
- Total number of imperiled species (within NatureServe G1/G2, T1/T2 and ESA E/T)
- Percentage of imperiled species in the selected geography that are forested vs. non-forested
- Percentage of forested imperiled species in the selected geography that are upland vs. wetland
- Percentage of forested imperiled species in the selected geography that are NatureServe (G1/G2) rank, ESA (E/T) listed or cross-listed (both)
In doing so, Forests in Focus members can identify areas of high significance to at-risk species that potentially overlap with their sourcing areas.
| Ranking | Critically Imperiled | Imperiled | Endangered | Threatened |
| Type | NatureServe Global Rank (1-5): | NatureServe Global Rank (1-5): | Endangered Species Act (ESA): | Endangered Species Act (ESA): |
| Definition | At very high risk of extinction or elimination due to very restricted range, very few populations or occurrences, very steep declines, very severe threats, or other factors.2 | At high risk of extinction or elimination due to restricted range, few populations or occurrences, steep declines, severe threats, or other factors.3 | Any species which is in danger of extinction throughout all or a significant portion of its range.4 | Any species which is likely to become an endangered species within the foreseeable future throughout all or a significant portion of its range.5 |
| Symbol | Species: G1
Subspecies: T1 |
Species: G2
Subspecies: T2 |
ESA: E | ESA: T |
RISK THRESHOLDS
| CRITERIA | LOWER RISK | MEDIUM RISK | HIGHER RISK |
| Imperiled Species | No known imperiled or critically imperiled species present. | Count of imperiled or critically imperiled species that is less than or equal to the national median (2 in a Hexagon or 27 in an Assessment Area). | Count of imperiled or critically imperiled species that is greater than the national median (2 in a Hexagon or 27 in an Assessment Area). |
For additional information, please visit the Imperiled Species page.
1 U.S. Fish & Wildlife Service. Why Save Endangered Species? 2005.
2, 3, 6 NatureServe. Definitions of NatureServe Conservation Status Ranks. Website.
4, 5 NOAA Fisheries. Endangered Species Act. Website.
IMPERILED ECOSYSTEMS
This criterion estimates the number of critically imperiled or imperiled ecosystem types present in the geography of interest. In the Assessment Area Dashboard, we use NatureServe data to report the following information at a Hexagon and Assessment Area level:
- Total number of imperiled ecosystem types within the selected geography (NatureServe G1/G2 and IUCN CR/EN)
- Percentage of imperiled ecosystem types that are forested vs. non-forested within the selected geography
- Percentage of forested imperiled ecosystem types that are upland vs. wetland within the selected geography
In doing so, Forests in Focus allows members to visualize how their sourcing areas may overlap with imperiled ecosystems. These areas are associated with ecosystem types that are either naturally quite rare or have faced severe declines in size and condition over time. The healthy functioning of these systems can support important ecological processes and provide habitat for both imperiled and secure species. Being able to identify these areas is a priority in the forestry community.
| Ranking | Critically Imperiled | Imperiled | Critically Endangered | Endangered |
| Type | NatureServe Global Rank (1-5): | NatureServe Global Rank (1-5): | IUCN Red List of Ecosystems: | IUCN Red List of Ecosystems: |
| Definition | At very high risk of extinction or elimination due to very restricted range, very few populations or occurrences, very steep declines, very severe threats, or other factors.2 | At high risk of extinction or elimination due to restricted range, few populations or occurrences, steep declines, severe threats, or other factors.2 | Considered to be at an extremely high risk of collapse.4 | Considered to be at a very high risk of collapse.5 |
| Rank Symbol | G1 | G2 | CR | EN |
RISK THRESHOLDS
| LOWER RISK | MEDIUM RISK | HIGHER RISK | |
| Imperiled Ecosystems | No known imperiled or critically imperiled ecosystem types present. | Count of imperiled or critically imperiled species that is less than or equal to the national median (2 in a Hexagon or 6 in an Assessment Area). | Count of imperiled or critically imperiled species that is less than or equal to the national median (2 in a Hexagon or 6 in an Assessment Area). |
For additional information, please visit the Imperiled Ecosystems page.
2, 3 NatureServe. Definitions of NatureServe Conservation Status Ranks. Website.
4, 5 IUCN. 2016. An Introduction to the IUCN Red List of Ecosystems. Resources – Conservation Tools.
GMO TREES
This criterion indicates the risk of genetically modified [organisms] (GMO) trees being harvested and entering supply streams. According to Forest Stewardship Council‘s (FSC) National Risk Assessment (NRA), risk for use of GMO trees was identified as “low” across the continental United States. The NRA indicates that, at the time of its compilation, GMO trees are not used commercially in the contiguous United States (excludes Alaska and Hawaii). However, if in the future, if GMO trees are approved for commercial use this criterion’s risk designations may change. For more information about this designation, refer to the full US NRA.
ILLEGAL HARVESTING
This criterion is designed to identify the risk of illegally harvested wood entering supply streams. According to the Forest Stewardship Council‘s (FSC) National Risk Assessment (NRA), illegal harvesting of wood in the United States is considered ‘low’ risk. The FSC NRA summarizes this designation with the following language, “Identified laws are upheld. Cases where law/regulations are violated are efficiently followed up via preventive actions taken by the authorities and/or by the relevant entities.” For more information about this designation, refer to the full US NRA.
RISK THRESHOLDS
| LOWER RISK | MEDIUM RISK | HIGHER RISK | |
| GMO Trees | An FSC-conducted National Risk Assessment concluded there is low risk of commercial GMO tree use in the contiguous United States. | N/A | N/A |
| Illegal Harvesting | An FSC-conducted National Risk Assessment concluded there is low risk of illegal harvesting in the contiguous United States. | N/A | N/A |
For additional information, please visit the GMO Trees or the Illegal Harvesting page.
IMPACT PROJECTS
Investing in Family Forests and Conservation Impact through Forest in Focus
In addition to helping members understand sustainability issues in their sourcing area, Forest in Focus membership offers a unique opportunity for members to leverage their resources to have an impact on these sustainability issues, with a focus on family-owned forests.
The following impact projects are managed by the American Forest Foundation. AFF is a leading national non-profit focused on delivering meaningful conservation impact through the empowerment of family forest landowners and works with thousands of diverse partners to accomplish this work.
To learn more about current Impact Project offerings, please visit the Impact Projects page.
We reserve the right to regularly review projects to ensure they meet the required outcomes. As a defining characteristic of Forests in Focus, these project opportunities offer an important collaboration mechanism by connecting state agencies, conservation organizations, and family forest owners with industry to achieve positive conservation impacts.
HOW TO USE THE SUMMARY DASHBOARD
- Select the Assessment Areas you’d like included in the analysis (do this by selecting mills). To make this process easier, available mills can be filtered by location, company or name.
- To filter by Location use the map (top left).
- To filter by Company or Mill Name, use the filter panels below the map.
- Explore sustainability insights for your Combined Assessment Area.
- Navigate to the Summary tab to visualize how risk varies between sustainability criteria.
- Visit the other tabs for additional and more detailed sustainability insights. Lastly, visit the Impact Project tab to identify which projects respond directly to sustainability risks identified in the tool.
HOW DOES FORESTS IN FOCUS WORK?
Forests in Focus is a landscape-level assessment of US timberland. The strength of this approach is that it allows for visibility beyond individual parcels. The landscape surrounding an individual mill is called an Assessment Area. Each Assessment Area is made up of many hexagons that contain data for each criterion. In the Summary Dashboard, users can select multiple assessment areas – or landscapes – for sustainability assessment. When multiple assessment areas are selected, a sustainability report is generated for the Combined Assessment Area.
Thresholds set for each criterion dictate if a hexagon is categorized as low, medium, or high risk (see Risk Categories). A consistent color scheme is used to represent these risk categories. Darker blue (higher risk) indicates that there may be a greater opportunity for conservation work, improved monitoring, targeted forest management, etc.
IMPACT PROJECTS
Forests in Focus includes a list of endorsed conservation impact projects that members collectively invest in. Each of the projects listed on Forests in Focus today have been evaluated thoroughly to ensure that they:
- Respond directly to sustainability issues identified in the platform
- Effectively and authentically engage family woodland owners
- Deliver measurable conservation outcomes on the ground.
USING SUSTAINABILITY INSIGHTS TO HELP INDUSTRY LEVERAGE THEIR COLLECTIVE POWER FOR GOOD.
We understand that our forests don’t exist in a vacuum; that climate change, development, agriculture, pollution, and other human interventions have, and will continue to have, lasting effects on ecosystems globally. Our members joined Forests in Focus so that they could come together, acknowledge risks to forest ecosystems, and leverage their power to drive on-the-ground conservation impacts.
DISCLAIMER
Many interacting factors contribute to sustainability criteria outcomes at a landscape scale (e.g. climate change, land-use changes for development and agriculture, pollution, etc.). Accordingly, low, medium, or high risk (e.g. risk of forest carbon loss or presence of imperiled species) designations cannot logically or reputably be attributed to any one cause or land-use type.
We also recommend that Forests in Focus members contact their suppliers if:
- they have questions about specific criteria results (i.e. imperiled species presence, etc.)
- want information on their supplier’s unique sourcing area
- would like to inquire about impact projects currently led by mills, converts or manufacturers.
RISK CATEGORIES
LOWER RISK |
MEDIUM RISK |
HIGHER RISK |
|
| Land Use Change | Less than or equal to 1% net loss of timberland annually, or a 5% net loss over a five-year period. | Between 1% to 2% net loss of timberland annually, or a 5% to 10% net loss over a five-year period. | More than 2% net loss of timberland annually, or a 10% net loss over a five-year period. |
| Forest Carbon | Less than or equal to 1% net loss of above-ground wood volume annually, or a 5% net loss over a five-year period. | Between 1% to 2% net loss of above-ground wood volume annually, or a 5% to 10% net loss over a five-year period. | More than 2% net loss of above-ground wood volume annually, or a 10% net loss over a five-year period. |
| Imperiled Species | No known imperiled or critically imperiled species are present. | Count of imperiled or critically imperiled species that is less than or equal to the national median (2 in a Hexagon or 27 in a Region of Sourcing). | Count of imperiled or critically imperiled species that is greater than the national median (2 in a Hexagon or 27 in a Region of Sourcing). |
| Imperiled Ecosystems | No known imperiled or critically imperiled ecosystem types are present. | Count of imperiled or critically imperiled species that is less than or equal to the national median (2 in a Hexagon or 6 in a Region of Sourcing). | Count of imperiled or critically imperiled species that is less than or equal to the national median (2 in a Hexagon or 6 in a Region of Sourcing). |
| Illegal Harvesting | An FSC-conducted National Risk Assessment concluded there is a low risk of illegal harvesting in the contiguous United States. | N/A | N/A |
| GMO Trees | An FSC-conducted National Risk Assessment concluded there is a low risk of commercial GMO tree use in the contiguous United States. | N/A | N/A |
DASHBOARD FEATURES
Feature |
Dimensions |
| Plot* | Plots are representative sampling units commonly used in field sampling. The FIA program collects information on forest health metrics using plots across the United States. |
| Hexagon (Hex or “Instance”) |  A six-sided polygon with an approximate area of 190,000 acres. This is the smallest unit of area for which we display a risk assessment and offer sustainability insights. A six-sided polygon with an approximate area of 190,000 acres. This is the smallest unit of area for which we display a risk assessment and offer sustainability insights.
|
| Assessment Area | 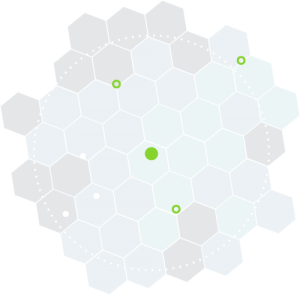 This approximately 8.5 million-acre area surrounds ONE [selected] mill and represents a theoretical supply basin where forest products are likely sourced.** It is composed of approximately 44 to 46 hexes that (in full or in part) fall within a generic 50-mile sourcing radius. This approximately 8.5 million-acre area surrounds ONE [selected] mill and represents a theoretical supply basin where forest products are likely sourced.** It is composed of approximately 44 to 46 hexes that (in full or in part) fall within a generic 50-mile sourcing radius.
|
| Combined Assessment Area | 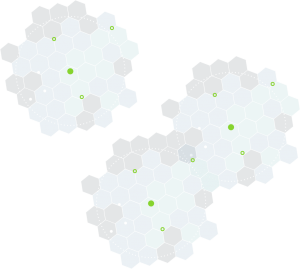 The combined assessment areas are associated with a selection of multiple mills and represent the areas from which these mills arelikely to source their forest products. This aggregated unit of measurement is only available in the Summary Dashboard and is useful for companies that want to summarize risks for their enterprises or specific product lines. We account for any overlaps in the regions of sourcing for individual mills to ensure the underlying land area is not “double-counted”. The combined assessment areas are associated with a selection of multiple mills and represent the areas from which these mills arelikely to source their forest products. This aggregated unit of measurement is only available in the Summary Dashboard and is useful for companies that want to summarize risks for their enterprises or specific product lines. We account for any overlaps in the regions of sourcing for individual mills to ensure the underlying land area is not “double-counted”.
|
*The number of plots within a hexagon and thus within a region(s) of sourcing may vary, impacting statistical reliability due to variation in sampling, small sample sizes, and/or lack of uniformity.
**Actual sourcing regions are specific to each mill and vary by tree species, seasonality, markets, and other factors.